BMC COMMUNITY HOSPITAL CORPORATION→BOSTON MEDICAL CENTER-SOUTH
Reviewed 2026-07-12
BMC South / Good Samaritan Medical Center
Ownership, control, relationships, and source records for BMC South / Good Samaritan Medical Center.Ownership receipt
What we can say clearly
BMC South / Good Samaritan Medical Center is marked red because reviewed sources connect it to a major nonprofit health-system family. This is system-control/accountability context, not a private-equity ownership or PE-backed contract claim.
- Finding
- Major nonprofit health-system accountability warning
- Last reviewed
- 2026-07-12
- Evidence
- 32 cited sources
Documented warningMajor nonprofit health-system accountability warning
BMC South is now operated by nonprofit BMC Health System after the October 1, 2024 Steward transaction. Current CMS ownership text may still show the former proprietary classification. The accountability focus is post-acquisition stabilization, public support, staffing and wage disputes, and separation of Steward-era liabilities from BMC-era decisions.
Major nonprofit health-system accountability warning
Last verified Jul 2026
Last verified Jul 2026
Financial assistance help
Bill Reduction Available
Dollar For lists this facility for hospital bill assistance. Eligibility depends on the hospital policy and patient circumstances.Control Map
This leads to this
Evidence limits
Red color requiredExact CMS CCN, EIN and legal-entity matching across CMS, IRS, audit and Massachusetts records.5 ownership sources checked32 total sources below
BMC South is not currently classified as PE-owned. It was acquired from Steward by nonprofit BMC Health System and is covered by a $137M supplemental-payment schedule over FY2025-FY2027. Labor complaints are credible attributed claims, but exact post-acquisition staffing and payroll files remain unavailable.
Research map
Every source, what it was used for, and how the finding connects
32 source pagesacross 21 websites
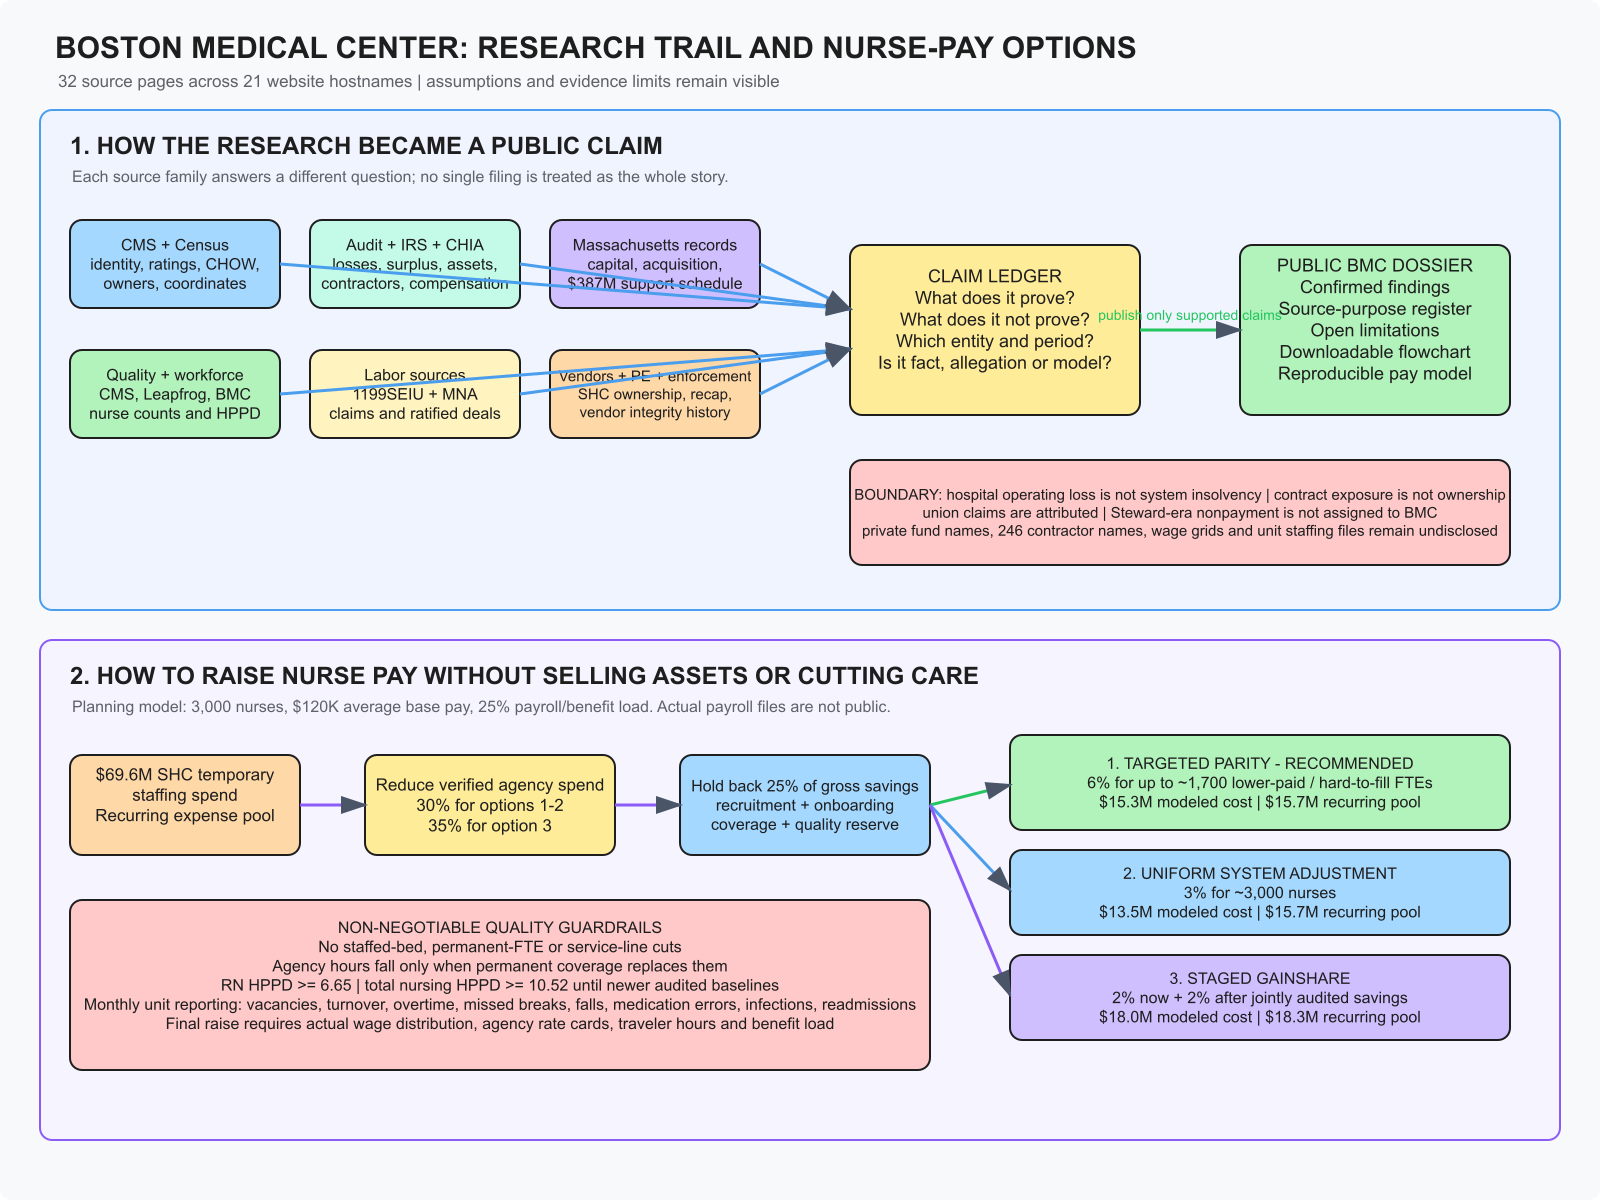
Purpose: Facility identity, coordinates, ownership labels, change-of-ownership events and quality ratings.
Finding: Locked CCNs 220031, 220036 and 220111 and separated stale CMS labels from current nonprofit control.
Purpose: Operating results, total margin, investments, liquidity, contractors, executive pay and community benefit.
Finding: Established the operating-loss versus total-surplus distinction and the $69.6M SHC staffing contract.
Purpose: Capital projects, acquisition review and former-Steward public support.
Finding: Reconciled BMC-specific supplemental payments to $387M: $137M South plus $250M Brighton.
Purpose: CMS/Leapfrog ratings, staffed beds, nurse counts and nursing-hours benchmarks.
Finding: Main campus is CMS 3 stars and Leapfrog A; public data still lacks unit-level staffing ratios.
Purpose: Contract outcomes, bargaining scope and attributed staffing/wage complaints.
Finding: Separated the main-campus 2023 raise history from current South/Brighton disputes and 2026 bargaining.
Purpose: Trace contractor ownership and historical integrity issues.
Finding: Confirmed PE-backed SHC contract exposure without relabeling BMC as PE-owned.
Nurse pay decision model
Three ways to raise pay without selling assets or cutting care
Recommended: Targeted campus parity and retention
Targeted campus parity and retention: use verified agency-spend conversion to fund a modeled 6% recurring raise for up to about 1,700 lower-paid or hard-to-fill nurse FTEs under the central assumptions.
Targeted campus parity and retention
6% recurring base-rate increase for up to approximately 1,700 lower-paid or hard-to-fill nurse FTEs
- Annual loaded cost
- $15.3M
- Recurring funding
- $15.7M
How: Reduce verified SHC spend 30%; reserve 25% of gross savings for conversion and quality.
Best targets documented pressure, but final cohort requires actual campus wage and vacancy files.Uniform system-wide adjustment
3% recurring base-rate increase for approximately 3,000 system nurses
- Annual loaded cost
- $13.5M
- Recurring funding
- $15.7M
How: Use the same 30% verified SHC-spend reduction and 25% reserve.
Simple and equitable to administer, but less targeted across different campus wage histories.Staged gainshare
2% guaranteed now plus 2% after jointly audited agency-hour and vacancy savings
- Annual loaded cost
- $18.0M at the full 4%
- Recurring funding
- $18.3M
How: Reduce verified SHC spend 35%; reserve 25% of gross savings for conversion and quality.
Protects liquidity, but the second installment needs an automatic transparent trigger.See assumptions, quality guardrails, and records BMC should disclose
Model assumptions
- Approximately 3,000 system nurses and more than 1,700 main-campus RNs are employer-published rounded counts.
- Central planning assumption: $120,000 average base pay and 25% marginal payroll/benefit load; $100,000 and $140,000 sensitivities are in the notebook.
- SHC temporary-staffing spend is $69,578,940 from the FY2024 Form 990 contractor table.
- Twenty-five percent of gross agency savings is reserved for recruiting, onboarding, temporary coverage and quality protection.
- The model is provisional because actual wage grids, agency bill rates, hours and campus allocation are not public.
Quality guardrails
- No staffed-bed, permanent-nurse-FTE or service-line cuts may fund the raise.
- Agency hours may fall only as permanent staffed hours rise or remain sufficient for acuity.
- Main-campus RN HPPD should not fall below 6.65 and total nursing HPPD should not fall below 10.52 unless a newer audited baseline replaces them.
- Report vacancies, turnover, overtime, missed breaks, falls, medication errors, CLABSI, CAUTI, readmissions and complaints monthly by unit and campus.
- Protect debt covenants, restricted funds and insurance reserves; do not borrow for recurring payroll.
Required disclosures
- Nurse roster and FTE distribution by campus, unit and wage step
- Current base-wage grids, differentials and marginal benefit load
- SHC and other agency master agreements, bill rates, hours, disciplines and conversion fees
- Vacancy, turnover, overtime, missed-break and acuity-adjusted staffing data
- A monthly bridge showing agency savings converted into permanent wages
Review Note
Why this page is published
primary government audited and attributed labor sources
Publish as a major nonprofit health-system accountability warning. Preserve the operating-loss/system-liquidity distinction, attribute union claims, and classify SHC as PE-backed contract exposure rather than BMC ownership.
Ownership & Control
Detailed records, kept below the answer
Sponsor, operator, CMS legal-owner/control records, and facility are shown as separate evidence layers.
See the full ownership chain
The platform attribution comes from the research tracker and is displayed separately from CMS legal-owner rows.
- CMS owner rows establish enrolled legal ownership or control roles; they do not always name the ultimate financial sponsor.
Connections
Who owns, backs, staffs, or connects to this facility
Controls the hospital, health plan and related entities; this is not shareholder ownership.
Explains much of the system’s scale and capitation revenue; regulated insurance resources are not automatically fungible for hospital payroll.
$69.6M FY2024 payment; vendor owned equally by Vistria Fund IV and Apollo Impact Mission.
Federal records document historical labor-fraud conduct tied to leadership; no evidence reviewed shows BMC participated.
$387M BMC-specific supplemental schedule across South and Brighton over FY2025-FY2027.
Leadership
Current accountability and official image status
President and CEO, BMC Health SystemAlastair Bell, MD, MBA
FY2024-return compensation totaled approximately $1.949M, including a $459,250 incentive component disclosed in Schedule J.
Compensation context: $1,949,276 reportable plus other compensation in the FY2024 return context
President, Boston Medical CenterAnthony Hollenberg, MD
Current hospital president; the filing amount may not represent a full year in the current title.
Compensation context: $964,350 reportable plus other compensation in the FY2024 return context
Chief Nursing Officer / senior clinical operations leadershipNancy Gaden, DNP, RN, NEA-BC
Named nursing executive in the compensation filing.
Compensation context: $842,263 reportable plus other compensation in the FY2024 return context
System Thread
Connected facilities and system family
- Boston Medical CenterBMC Health System · Boston, MA · Academic medical center / main campus
- Boston Medical Center-BrightonBMC Health System · Brighton, MA · Acquired former St. Elizabeth’s
- Boston Medical Center-SouthBMC Health System · Brockton, MA · Acquired former Good Samaritan
Timeline
Ownership history and events
- BMC South enters BMC Health System
CMS CHOW and BMC/State sources document the transfer from Steward. The MTF schedule assigns $137M in supplemental payments over FY2025-FY2027.
- operates
BMC Health System is the nonprofit parent/control layer for the hospital, health plan and related organizations.
- temporary staffing contract
BMC paid SHC Services/Supplemental Health Care $69.6M in the FY2024 contractor table; Vistria Fund IV and Apollo Impact Mission are equal owners of the vendor. This is contract exposure, not BMC ownership.
- acquired and operates
BMC Health System acquired Good Samaritan/BMC South and St. Elizabeth’s/BMC Brighton after Steward’s bankruptcy.
Metrics
Financial and utilization series
| Metric | Period | Value | Method note |
|---|---|---|---|
| net patient revenue | 01/01/2023 to 12/31/2023 | $315,682,440 | Hospital Provider Cost Report value. Compare only like fields and compatible fiscal periods; no causal inference is implied. |
| net patient revenue | 01/01/2022 to 12/31/2022 | $300,198,268 | Hospital Provider Cost Report value. Compare only like fields and compatible fiscal periods; no causal inference is implied. |
| net patient revenue | 01/01/2021 to 12/31/2021 | $298,592,037 | Hospital Provider Cost Report value. Compare only like fields and compatible fiscal periods; no causal inference is implied. |
| operating expense | 01/01/2023 to 12/31/2023 | $297,820,615 | Hospital Provider Cost Report value. Compare only like fields and compatible fiscal periods; no causal inference is implied. |
| operating expense | 01/01/2022 to 12/31/2022 | $278,012,571 | Hospital Provider Cost Report value. Compare only like fields and compatible fiscal periods; no causal inference is implied. |
| operating expense | 01/01/2021 to 12/31/2021 | $265,827,248 | Hospital Provider Cost Report value. Compare only like fields and compatible fiscal periods; no causal inference is implied. |
| net income | 01/01/2023 to 12/31/2023 | $39,340,400 | Hospital Provider Cost Report value. Compare only like fields and compatible fiscal periods; no causal inference is implied. |
| net income | 01/01/2022 to 12/31/2022 | $43,240,695 | Hospital Provider Cost Report value. Compare only like fields and compatible fiscal periods; no causal inference is implied. |
| net income | 01/01/2021 to 12/31/2021 | $46,069,159 | Hospital Provider Cost Report value. Compare only like fields and compatible fiscal periods; no causal inference is implied. |
| total assets | 01/01/2023 to 12/31/2023 | $563,852,535 | Hospital Provider Cost Report value. Compare only like fields and compatible fiscal periods; no causal inference is implied. |
| total assets | 01/01/2022 to 12/31/2022 | $500,758,575 | Hospital Provider Cost Report value. Compare only like fields and compatible fiscal periods; no causal inference is implied. |
| total assets | 01/01/2021 to 12/31/2021 | $362,880,203 | Hospital Provider Cost Report value. Compare only like fields and compatible fiscal periods; no causal inference is implied. |
| total liabilities | 01/01/2023 to 12/31/2023 | $217,019,726 | Hospital Provider Cost Report value. Compare only like fields and compatible fiscal periods; no causal inference is implied. |
| total liabilities | 01/01/2022 to 12/31/2022 | $161,687,549 | Hospital Provider Cost Report value. Compare only like fields and compatible fiscal periods; no causal inference is implied. |
| total liabilities | 01/01/2021 to 12/31/2021 | $71,319,929 | Hospital Provider Cost Report value. Compare only like fields and compatible fiscal periods; no causal inference is implied. |
| contract labor direct patient care | 01/01/2023 to 12/31/2023 | $5,582,153 | Hospital Provider Cost Report value. Compare only like fields and compatible fiscal periods; no causal inference is implied. |
| contract labor direct patient care | 01/01/2022 to 12/31/2022 | $6,798,954 | Hospital Provider Cost Report value. Compare only like fields and compatible fiscal periods; no causal inference is implied. |
| contract labor direct patient care | 01/01/2021 to 12/31/2021 | $5,509,425 | Hospital Provider Cost Report value. Compare only like fields and compatible fiscal periods; no causal inference is implied. |
| fte employees | 01/01/2023 to 12/31/2023 | 1,130.91 FTE | Hospital Provider Cost Report value. Compare only like fields and compatible fiscal periods; no causal inference is implied. |
| fte employees | 01/01/2022 to 12/31/2022 | 1,112.39 FTE | Hospital Provider Cost Report value. Compare only like fields and compatible fiscal periods; no causal inference is implied. |
| fte employees | 01/01/2021 to 12/31/2021 | 1,178.66 FTE | Hospital Provider Cost Report value. Compare only like fields and compatible fiscal periods; no causal inference is implied. |
| beds | 01/01/2023 to 12/31/2023 | 208 beds | Hospital Provider Cost Report value. Compare only like fields and compatible fiscal periods; no causal inference is implied. |
| beds | 01/01/2022 to 12/31/2022 | 208 beds | Hospital Provider Cost Report value. Compare only like fields and compatible fiscal periods; no causal inference is implied. |
| beds | 01/01/2021 to 12/31/2021 | 246 beds | Hospital Provider Cost Report value. Compare only like fields and compatible fiscal periods; no causal inference is implied. |
| patient days | 01/01/2023 to 12/31/2023 | 66,296 days | Hospital Provider Cost Report value. Compare only like fields and compatible fiscal periods; no causal inference is implied. |
| patient days | 01/01/2022 to 12/31/2022 | 58,991 days | Hospital Provider Cost Report value. Compare only like fields and compatible fiscal periods; no causal inference is implied. |
| patient days | 01/01/2021 to 12/31/2021 | 63,033 days | Hospital Provider Cost Report value. Compare only like fields and compatible fiscal periods; no causal inference is implied. |
| discharges | 01/01/2023 to 12/31/2023 | 15,250 discharges | Hospital Provider Cost Report value. Compare only like fields and compatible fiscal periods; no causal inference is implied. |
| discharges | 01/01/2022 to 12/31/2022 | 12,778 discharges | Hospital Provider Cost Report value. Compare only like fields and compatible fiscal periods; no causal inference is implied. |
| discharges | 01/01/2021 to 12/31/2021 | 13,785 discharges | Hospital Provider Cost Report value. Compare only like fields and compatible fiscal periods; no causal inference is implied. |
| scheduled steward transition support | 2025-2027 to 2025-2027 | $137,000,000 | $137M supplemental-payment schedule for Good Samaritan Medical Center. |
| cms overall rating | 2026 to 2026 | 2 stars | Current reviewed CMS snapshot. |
Evidence Notes
Contradictions, limitations, and unavailable fields
Open evidence notes
Hospital and post-acquisition operations show real recurring losses.
The consolidated system reported a positive after-tax excess, substantial investments and $1.63B available within one year.
Resolution: Both can be true; affordability claims must identify the entity, restriction, period and recurring funding source.Unions report staffing, retention, wage and benefit problems, especially at South and Brighton.
BMC says offers are market competitive; the main campus previously negotiated a large 2023 RN increase.
Resolution: Attributed dispute; actual wage-grid, vacancy and unit-staffing files are needed for adjudication.Only the five largest contractors are named publicly even though 251 received more than $100,000.
Private investment-fund names and managers are not disclosed in the audited statements.
Exact nurse wage distribution, marginal benefit load, agency hours/rates and campus allocation are not public.
CMS ownership labels can lag the October 2024 nonprofit acquisition of South and Brighton.
Union statements are attributed claims, not independent staffing audits.
The nurse-pay options are planning models, not forecasts or collective-bargaining terms.
Pre-October 2024 cost-report history reflects Steward-era operations and should not be treated as post-acquisition BMC performance.
Facility-specific post-acquisition audited statements are not publicly available in the reviewed sources.
all_251_contractors_over_100k
private_fund_names_managers_and_fees
nurse_wage_distribution_by_campus_and_step
agency_bill_rates_hours_disciplines_and_campus_allocation
unit_level_vacancy_turnover_overtime_acuity_and_assignments
executive_incentive_scorecard
fy2025_audit_remediation_status
BMC Health System -> Boston Medical Center: nonprofit parent/control relationship.
BMC Health System -> BMC South and BMC Brighton: October 1, 2024 acquisition and operating relationship.
Vistria Fund IV + Apollo Impact Mission -> Supplemental Health Care -> BMC: vendor ownership and staffing-contract path.
Commonwealth of Massachusetts -> South/Brighton: scheduled supplemental support for post-Steward stabilization.
Publish all 251 contractors over $100,000, not only the top five.
Publish SHC rate cards, traveler hours, disciplines, campus allocation and conversion fees.
Publish unit-level staffing, vacancy, turnover, overtime, missed-break and acuity data.
Publish private investment-fund names, managers, fees and health-care portfolio exposure.
Publish the executive incentive scorecard and FY2025 audit remediation.
Reconcile the $387M South/Brighton support schedule to actual annual expenditures.
Download
Take the evidence with you
Sources
Evidence and source documents
audited_filingConsolidated finances, investments, debt, acquisitions and audit controlsBMC Health System/KPMGtax_filingHospital revenue, expenses, contractors, executive compensation, community benefit and related-party disclosureIRS via ProPublicatax_filingParent-system governance and related organizationsIRS via ProPublicatax_filingWellSense health-plan finances and related-system scaleIRS via ProPublicagovernment_profileHospital-specific financial, utilization, payer mix, staffed beds and system margin cross-checkCenter for Health Information and Analysispolicy_analysisReconcile BMC-specific former-Steward supplemental payments with statewide package headlinesMassachusetts Taxpayers Foundationgovernment_dataFacility identity, current CMS ownership label and overall quality ratingCenters for Medicare and Medicaid Servicesgovernment_dataConfirm the October 1, 2024 change of ownership at Brighton and SouthCenters for Medicare and Medicaid Servicesgovernment_dataCheck current enrolled owners and PE/investment-firm flagsCenters for Medicare and Medicaid Servicesquality_ratingSafety grade, Magnet status, beds, volumes and nursing-hours benchmarksThe Leapfrog Groupemployer_pageMain-campus nurse workforce lower boundBoston Medical Centeremployer_pageSystem-wide planning denominatorBMC HealthCityunion_statementEstablish the prior main-campus wage contract and bargaining-unit scale1199SEIUunion_statementIdentify active 2026 system bargaining and workforce scope1199SEIUunion_statementTrack contract result for non-MNA workers at Brighton and South1199SEIUunion_statementDocument current BMC South nurse and health-professional complaintsMassachusetts Nurses Associationunion_statementCheck the latest identified BMC South bargaining statusMassachusetts Nurses Associationemployer_releaseConfirm acquisition effective date and current system namesBMC Health Systemgovernment_releaseConfirm signed transfer agreements and public purposeCommonwealth of Massachusettsgovernment_filingMain-campus capital project and community-health obligationMassachusetts Department of Public Healthgovernment_filingRegulatory review of former-Steward acquisitionsMassachusetts Health Policy CommissionreportingCurrent post-acquisition financial pressure and BMC-specific state supportBoston Globegovernment_dataHistorical federal grants and contract obligationsUSAspending.govfederal_enforcementHistorical Medicare compliance checkHHS Office of Inspector Generalfederal_docketCheck labor-law case filingsNational Labor Relations Boardowner_releaseTrace the private-capital owner of BMC's largest disclosed temporary-staffing vendorVistria Groupowner_releaseCheck financing and distributions at the staffing vendorVistria Groupfederal_enforcementHistorical integrity check for a disclosed construction vendorU.S. Department of Labor OIG/USAOvendor_pageMatch the current vendor identity, address and principalsSouthern Middlesex Industriesemployer_pageIdentify publicly acknowledged corporate relationships and sponsorshipsBoston Medical Centertrade_reportingIdentify BMC Brockton Behavioral Health Center project team and costEngineering News-Recordvendor_releaseIdentify an electrical trade contractor on BMC capital workMcDonald Electrical Corporationfederal cost-report datasetCMS Hospital Provider Cost Report dataCenters for Medicare & Medicaid Services